A new report, by order of the European Commission, studying the Subsidies and costs of EU energy just came out (published by Ecofys. KPMG and the Centre for Social and Economic Research). This study is particular noteworthy since it is one of the first that attempts to provide useful data on energy costs and subsidies for all EU Member States and for all technologies. Here is a quick summary of the most interesting findings as well as some thoughts and discussions.
Figure S – 2 shows the total value of current interventions in 2012 for energy production of 14 different technology categories and separately for energy demand and energy savings. The largest single category of intervention is for energy demand which covers measures that would encourage the use of energy such as tax reductions for particular users. In general, support to energy demand tends to support individual fuels in proportion to their place in the fuel mix, which in the EU is still dominated by gas, coal and nuclear. Support to production of electricity or of primary fuels such as coal, gas and oil makes up almost 70% of the total support. Of this, most support is given to the renewable energy technologies, particularly solar, although significant support is also given to coal and nuclear, including decommissioning and waste disposal. Support to energy savings (i.e. for reducing energy use) is around 8% of the total.
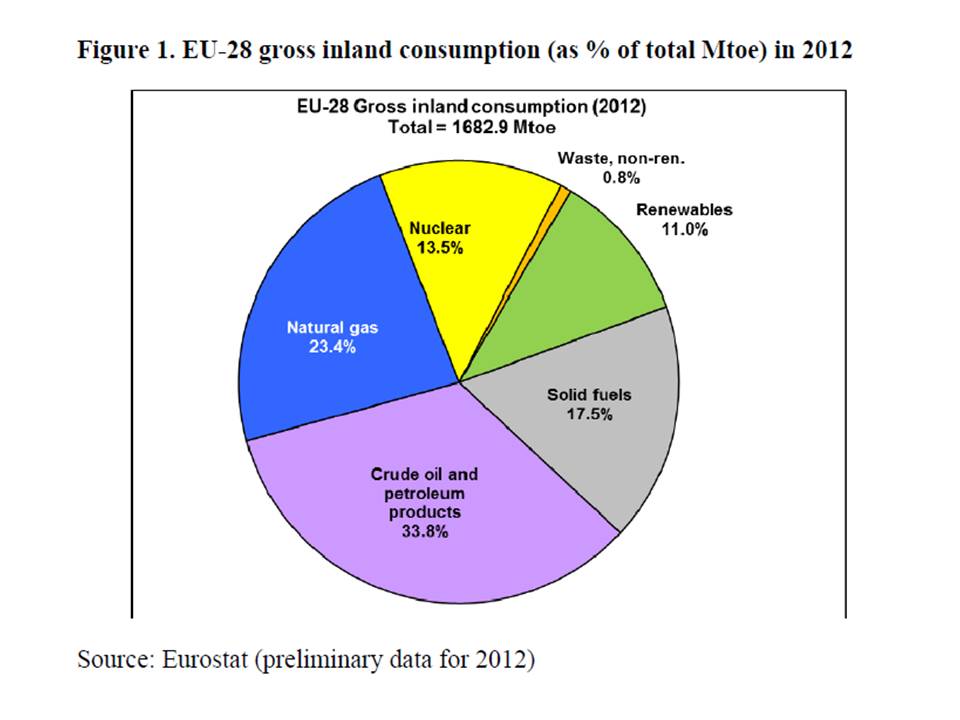
The graph below is the Figure S-2 cited above.  What is interesting is that the support to energy demand is relatively large, and it supports individual fuels in proportion to their place in the fuel mix. If we take the EU-25 energy consumption mix into account, then Figure 1 below shows that 74.7% (or 20 billion euros) of the support for energy demand goes to oil, gas and coal, 13.5% (or 3.8 billion euros) to nuclear and 11% (or 3 billion euros) to renewables. That pushes the total support for fossil fuels to a total of 37 billion euros, the support for renewables to roughly 43 billion euros, and for nuclear to 11 billion euros. Conclusively, according to this report, renewable energy has seen the largest support by the EU in 2012.
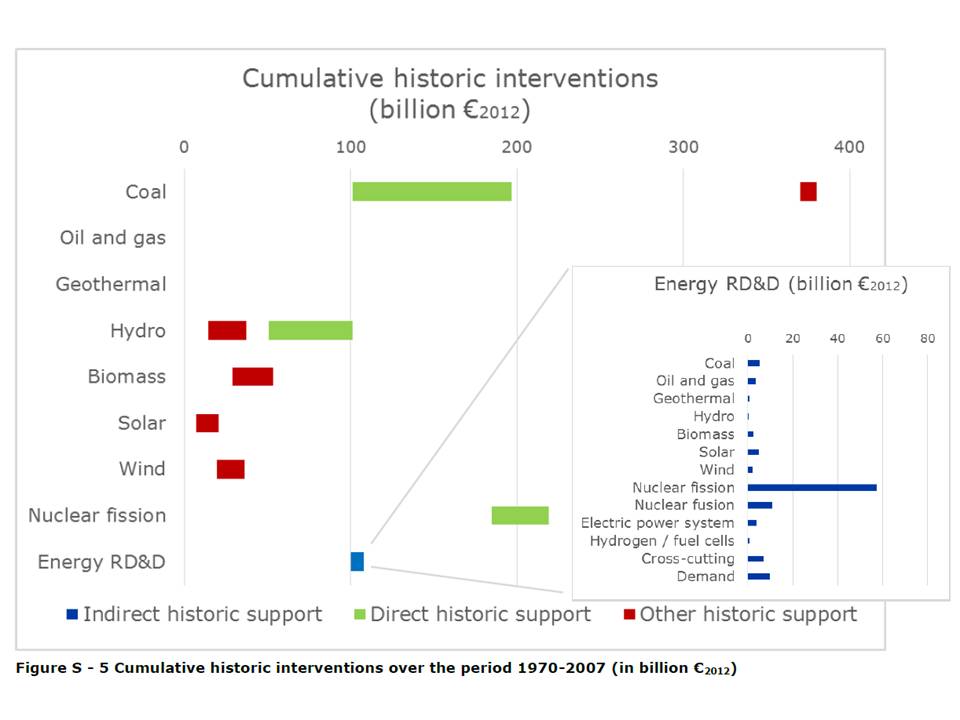
How does this compare to the cumulative support since the 70s? Figure S-5 below shows what type of energy input received how much support since 1970. Overall, nuclear energy is by far the largest benefiter from support. It received roughly 270 billion in support. Renewable’s cumulative support is roughly 200 billion, mostly due to Hydro and biomass. Solar and Wind energy only received a total of roughly 60 billion. Non-renewables’ support, made up nearly exclusively from support to coal, is at roughly 200 billion.
 The next Figure S-6 shows the amount of external costs which are indirect costs to society like environmental impacts.
Total external costs are estimated to be € 200 billion. The three biggest impacts are climate change, accounting for approximately half of the total, depletion of energy resources accounting for a further 22% and particulate matter formation, constituting 15% of the total. The remaining 13% of impacts include human toxicity, agricultural land occupation, water depletion, metal depletion, ecosystem toxicity, radiation, acidification and eutrophication.
Here the impacts from fossil fuels are clearly the highest, followed by nuclear energy and then renewable sources of energy.  Figure S-7 shows the so-called levelised costs of energy. These levelised costs attempt to provide an estimate for the cost competitiveness of the different power generation technologies of new power generation without public intervention. We can see that the estimates for renewable energy sources, especially hydropower, solar and wind, are very close to nuclear energy and fossil fuels. In particular, the estimates show that the costs for solar energy have halved over the course of only 4 years!
 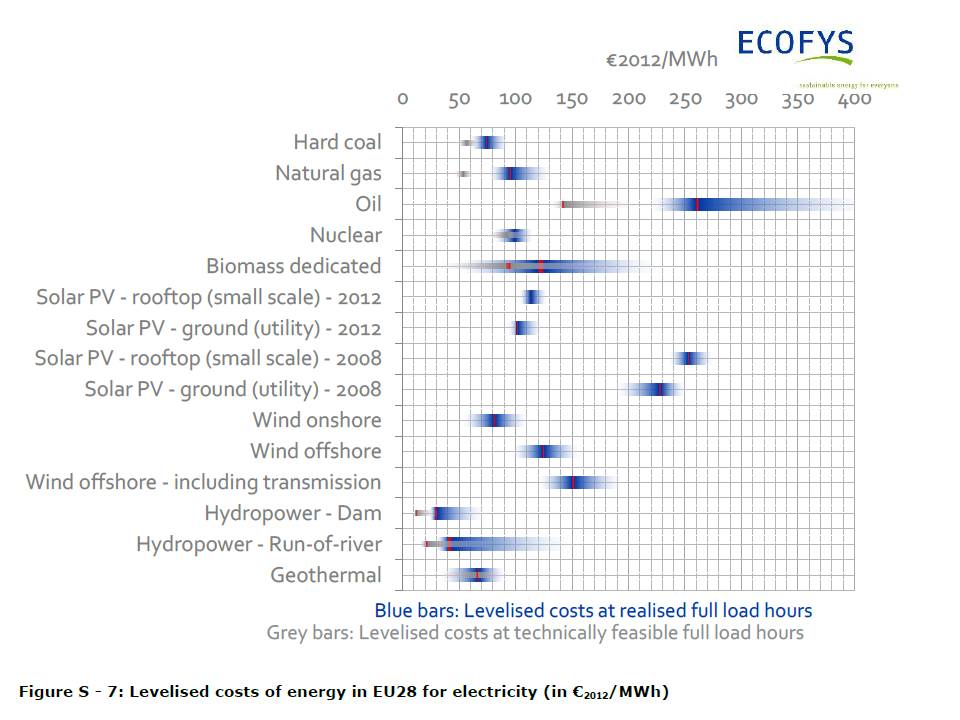 A conclusion: Given the limited cumulative subsidies that solar and wind energy have received in comparison to the established energy sources like nuclear and fossil fuels, and given their current cost competitiveness to nuclear energy and fossil fuels, it seems surprising that countries like the United Kingdom would opt for more nuclear energy with a fixed price for the next 35 years. In effect, the levelised costs for solar energy, having halved in only 4 years, are already competitive to what UK will pay EDF for the electricity that Hinkley Point C would produce. Imagine the potential improvements in cost competitiveness that solar energy may gain during the next 35 years!
My overall reading from this report is that renewable energies seem to have a currently high level of support from the EU; that there is still room for further subsidies based on the cumulative support that fossil fuels and nuclear energy have received during the past 40 years; that the social costs of both fossil fuels and nuclear energy are larger than those of renewables and consequently any policy should carefully consider these in the full costs of energy mix; that renewable energy is competitive once all the additional costs are figured in.
